Gaussian을 타원형으로 시각화한다. Kalman filter, Gaussian Splatting, VAE(Variational Auto Encoder), low pass filter의 smoothing Kernel... etc. 많은 곳에서 Gaussian이 쓰인다. 이런 알고리즘들은 공분산을 타원으로 시각화하고, 타원으로 샘플을 추출한다. 해당 포스팅은 3가지로 나뉜다.
- 첫째, Background에선 Gaussian의 정의와 타원이 나타내는 의미에 대해서 서술한다.
- 둘째, LU 분해를 통해 covariance matrix에서 sampling하는 방법에 관해 서술한다.
- 셋째, covaraince matrix에서 타원을 그리는 방법에 관해 서술한다.
1. Background
1.1 Gaussian Distribution이란 무엇인가?
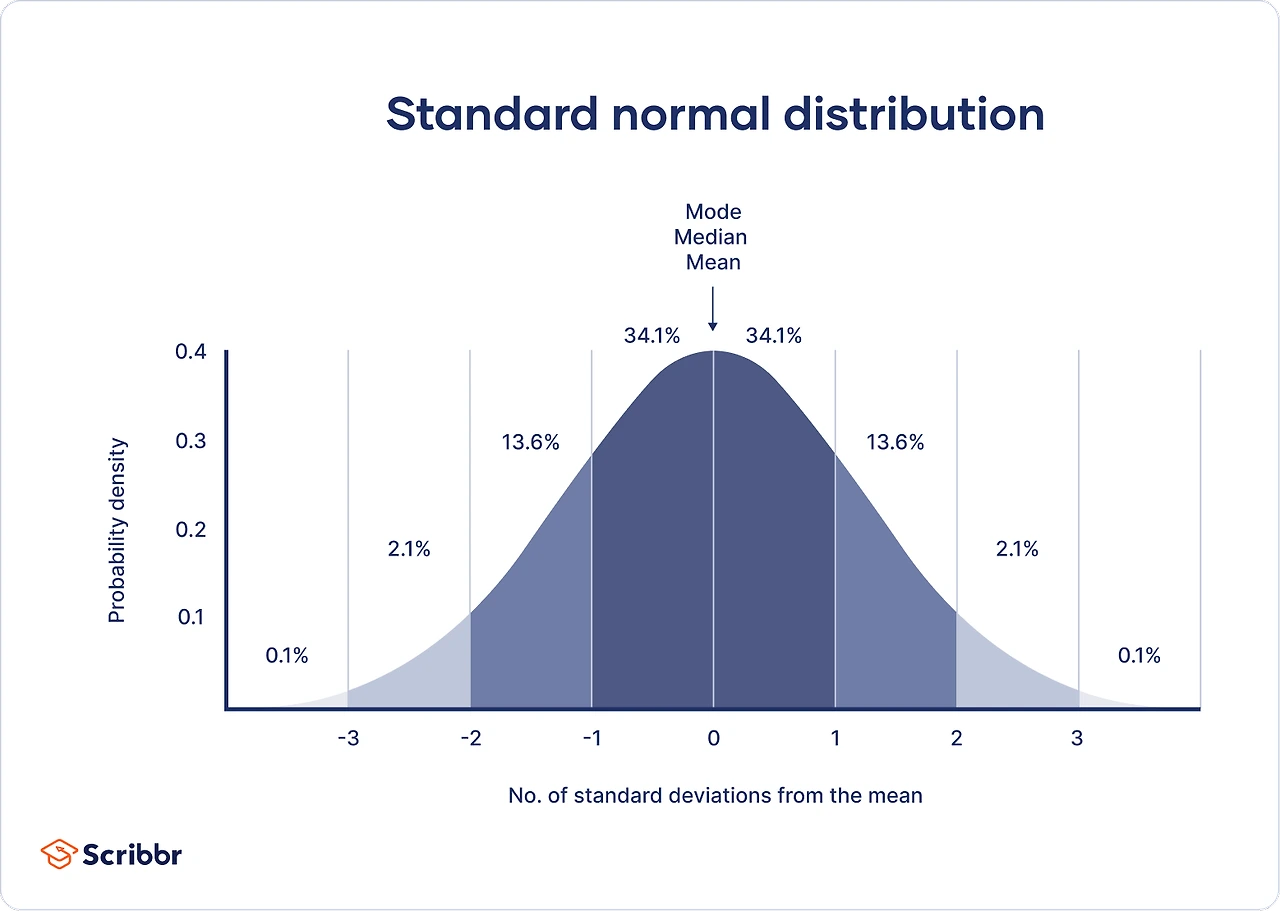
Gaussian Distribution은 Normal Distribution이라고도 불린다.
$$ X \sim\mathcal{N}(\mu,\,\sigma^{2}) \tag{1} $$
이것은 확률 변수 x 가 Gaussian을 따른 다는 표시이다.
$$ f(x)={1\over\sqrt{2\pi\sigma^2}}\exp\left(-{(x-\mu)^2\over2\sigma^2}\right) \tag{2} $$
$$ f(\mathbf{x}) = \frac{1}{(2\pi)^{k/2} |\Sigma|^{1/2}} \exp\left(-\frac{1}{2} (\mathbf{x} - \boldsymbol{\mu})^T \Sigma^{-1} (\mathbf{x} - \boldsymbol{\mu})\right) \tag{3} $$
$$ f(\mathbf{x}) = \exp\left(\mathbf{h}^T \mathbf{x} - \frac{1}{2} \mathbf{x}^T \mathbf{J} \mathbf{x} - \frac{k}{2} \ln(2\pi) + \frac{1}{2} \ln |\mathbf{J}|\right) \tag{4} $$
$$ \mathbf{J} = \Sigma^{-1} \quad \text{and} \quad \mathbf{h} = \Sigma^{-1} \boldsymbol{\mu} \tag{5} $$
Gaussain의 PDF는 이와 같이 나타난다. 즉, 지수항에 2차 다항식이 올라가 있는 형태이다. gaussian의 pdf는 두가지 형태로 나타낼 수 있다. 수식(3)이 Cannonical (Standard) Form이고, 수식(4)가 Information Form이다. SLAM에서는 수식(4)의 형태를 더 자주 쓴다. 왜냐하면 불확실성이 무한인 상태와, 다른 gaussian을 곱할 때 편리하기 때문이다. 예를 들어, 처음 관측한 물체가 확실하지 않을 때 covraince matrix를 무한으로 설정해야 한다. canonical form을 이용하면 covariance matrix가 무한인 것을 information matrix가 0인 것으로 둘 수 있다.
- information matrix를 hessian matrix라고도 부른다. 이는 관측에 대한 Jacobian matrix의 (J^TJ)로 근사해서 Hessian matrix라고 부를 수도 있다.
1.2 타원이 의미하는 바는 무엇인가?
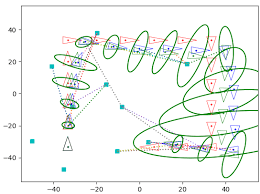
타원이 의미하는 것은 표준편차 (Standard deviation)이 1인 부분을 나타낸다. Figure1는 표준편차가 1인 정규분포 타원 안에는 68% 정도의 sample point들이 존재한다는 것을 보여준다. 표준편차가 2인 타원 안에는 95%의 sample, 3인 타원 안에는 99.75%의 sample들이 들어간다.
- 표준편차 거리를 Mahalonovis 거리라고도 한다.
1.3 Semi-positive definite(양의 정부호 행렬)이란 무엇인가?
$$ xMx^T >= 0 $$
모든 벡터 x에 대해, 항상 0이상의 값을 내는 matrix M을, semi-positive definite이라 한다.
이런 semi-positive definite 한 matrix는 타원으로 시각화, 샘플링이 가능하다.
- 어떻게 만드는지
어떤 matrix를 M^T * M 하면 semi-positive definite이 된다. - symetric matrix이다.
- Covariance matrix도 semipositive definite matrix이다.
대부분의 covariance matrix는 대각 요소(분산)가 비대각 요소(공분산)보다 일반적으로 크다. 다중공선성이 높은 경우 변수 간 상관관계가 커져 공분산이 분산에 가깝거나 잠깐 더 커질 수 있다.
가령,
[ [36, 44],
[44, 56]]
는 일반적이진 않은 covriance matrix이다. 그냥 semi-positive definite 행렬이다.
[[1,2,3],
[4,5,6]]
의 곱으로 만들었다.
2. Multivariate Gaussian에서 샘플링하는 방법
Gaussian은 선형변환 하여도 Gaussian이라는 원리를 활용해, 표준 정류분포를 L matrix (하삼각행렬)에 넣어서 sampling 할 수 있다.
LU분해 중, semi-positive definite 한 행렬은 숄레스키 분해(cholensky decomposition)가 가능하다. L L^T로 대칭적인 semi-postitive definite 행렬을 나타낼 수 있다. 이때 L과 normal distribution을 이용해 Covarinace matrix 기반의 sampling을 수행할 수 있다.

X 가 Idenity인 서로 독립은 Multivariate gaussain에 L(하 삼각행렬)을 통해 구할 수 있다.
샘플링 코드는 다음과 같다.
ps. 하나의 matrix에 대해서 LU, QR decomposition은 유일하지 않다. 그래서 L과 R의 diagonal term을 1로 맞춘다.
import numpy as np
import matplotlib.pyplot as plt
from matplotlib.patches import Ellipse

# 1. 공분산 행렬 정의
cov_matrix = np.array([[36, 44],
                       [44, 56]])

# 2. Cholesky 분해 수행
L = np.linalg.cholesky(cov_matrix)

# 3. 표준 정규분포에서 난수 생성
n_samples = 500
standard_normal_samples = np.random.randn(n_samples, 2)

# 4. Cholesky 분해 결과를 이용해 다변량 정규분포 난수 생성
multivariate_normal_samples = standard_normal_samples @ L.T

# 5. 고유값과 고유벡터 계산 (타원의 축 길이와 방향을 결정)
eigvals, eigvecs = np.linalg.eigh(cov_matrix)

# 6. 타원의 축 길이 (표준 편차 = 고유값의 제곱근)
axis_lengths = np.sqrt(eigvals)

# 7. 타원의 기울기 (상관관계에 따른 기울기 = 첫 번째 고유벡터의 방향)
angle = np.degrees(np.arctan2(*eigvecs[:, 0][::-1]))

# 8. 타원 생성
ell = Ellipse(xy=(0, 0), width=2 * axis_lengths[0], height=2 * axis_lengths[1],
              angle=angle, edgecolor='r', facecolor='none')

# 9. 시각화
fig, ax = plt.subplots()

# Cholesky 분해를 통한 샘플링 산점도 표시
ax.scatter(multivariate_normal_samples[:, 0], multivariate_normal_samples[:, 1], s=10, alpha=0.5, label='Cholesky Samples')

# 타원 추가
ax.add_patch(ell)

# 설정
ax.set_xlim(-40, 40)
ax.set_ylim(-40, 40)
plt.title("Cholesky Decomposition Sampling with Ellipse")
plt.xlabel("X1")
plt.ylabel("X2")
plt.grid(True)
plt.gca().set_aspect('equal', adjustable='box')
plt.legend()
plt.show()
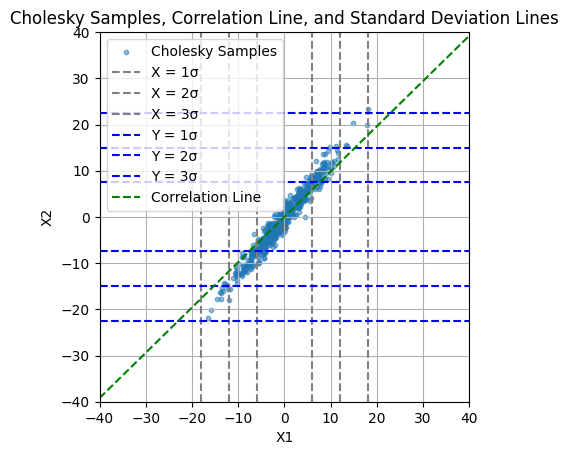
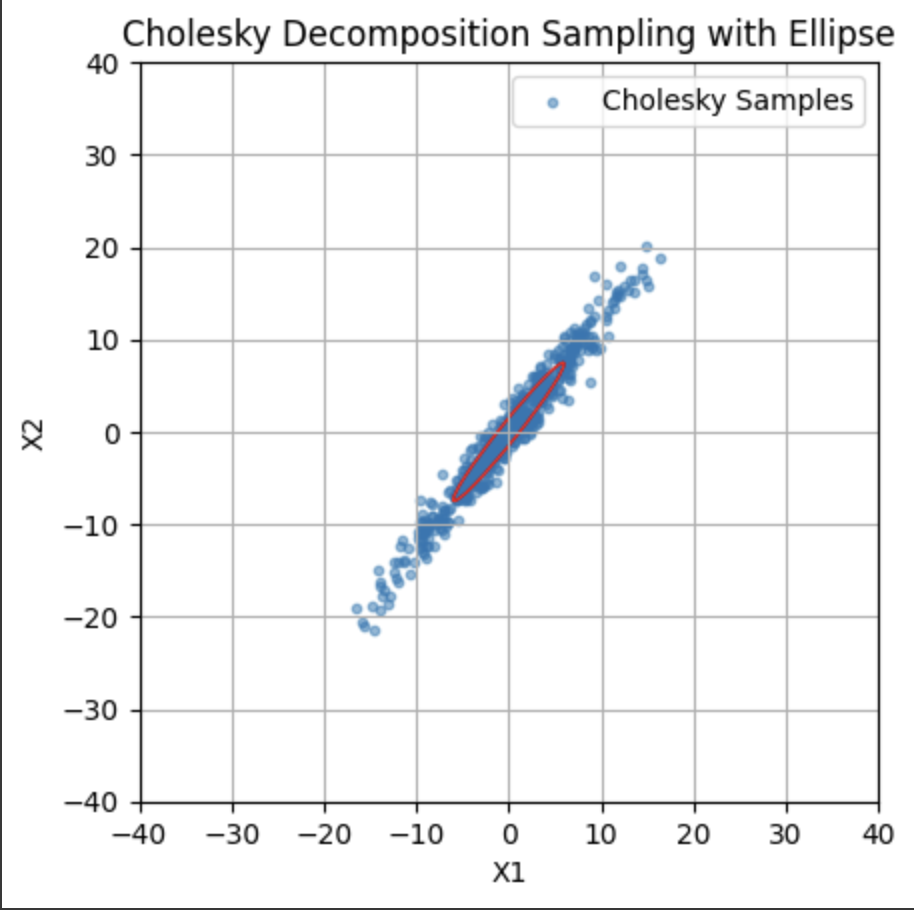
| 행과 열로 비교한 sigma 값 | egien value 에 해당하는 타원 (68%) | eigen value x2에 해당하는 타원 (95%) |
 |
 |
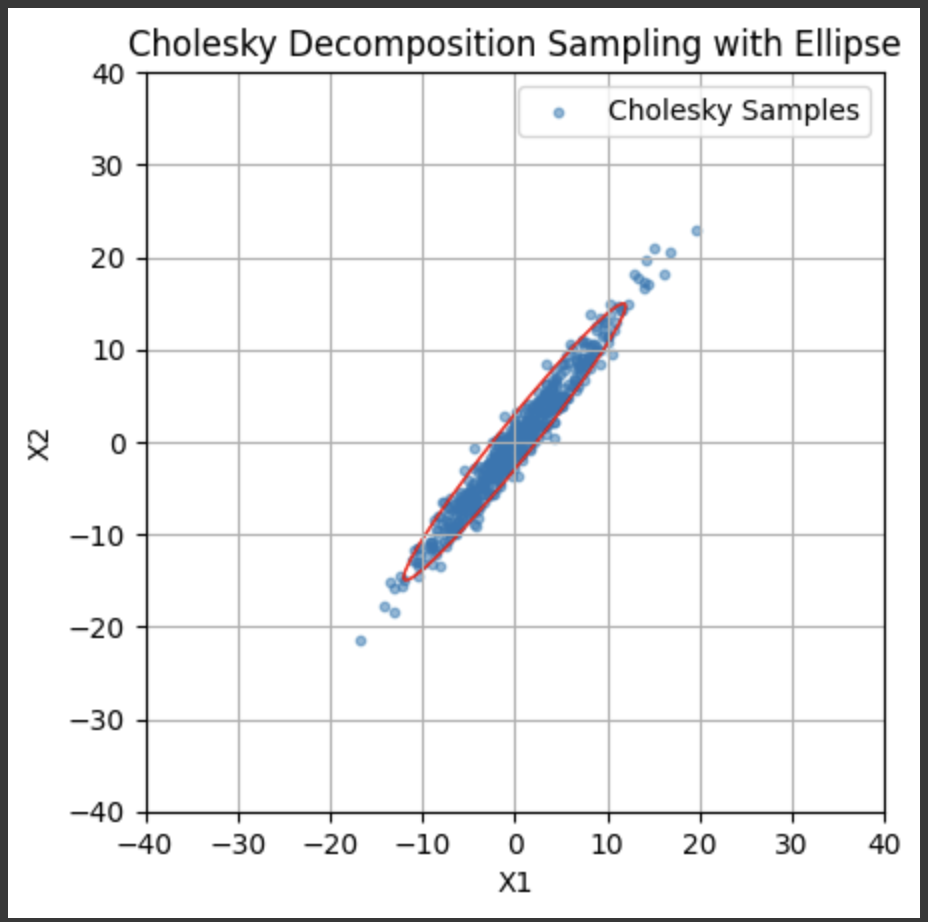 |
여기서 중요하게 볼 것은 기울기(correlation coefficient, slop)가 타원의 기울기를 나타내진 않는다는 것이다. 첫 번째 graph에서 그린 correlation의 기울기가 타원의 eigen vector 방향과 다르다.
3. Gaussian의 covariance를 타원으로 시각화하는 방법
두 가지가 있다. 전자가 더 명확하게 나온다.
- Eigen value decomposition을 한다.
covariance matrix를 SVD나 eigen value decomposition을 한 후, 가장 큰 2개의 eigen value와 vector를 기반으로 그린다.
코드는 위의 예시와 같다. - Cholesky 분해와 QR 분해를 활용한다.
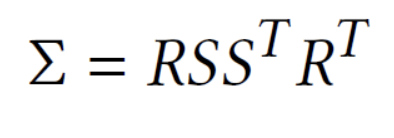
LU 분해를 통해 두 개의 행렬로 분해한 후, Rotation 요소와 Scale요소 두 가지로 분해하여 분석한다.
Gaussian Splatting에서 Sigma인 covariance matrix를 이런 형식으로 변환해서 decomposition 시킨다. 이전에 panorama image를 만들 때에도 이렇게 분리해서 시도했다.
코드는 다음과 같다.
import numpy as np
import matplotlib.pyplot as plt
from matplotlib.patches import Ellipse

# 1. 공분산 행렬 정의
cov_matrix = np.array([[36, 44],
                       [44, 56]])

# 2. Cholesky 분해 수행 (L 행렬 구하기)
L = np.linalg.cholesky(cov_matrix)

# 3. L 행렬을 QR 분해하여 회전 행렬(Q)과 스케일 행렬(R)로 분해
Q, R = np.linalg.qr(L)

# 4. R R^T 계산 (타원의 축 길이를 결정하는 스케일 정보)
RRt = R @ R.T

# 5. RRt의 고유값을 계산하여 타원의 반지름(축 길이)을 결정
eigvals_rrt, _ = np.linalg.eigh(RRt)
axis_lengths_rrt = np.sqrt(eigvals_rrt)

# 6. 회전 행렬 Q에서 회전 각도 계산 (Q는 회전 정보)
angle_q = np.degrees(np.arctan2(Q[1, 1], Q[0, 1]))
# angle_q = np.degrees(np.arctan2(Q[0, 0], Q[1, 0])) # flipped output

# 7. 타원 생성 (QR 분해로 얻은 회전과 스케일 적용)
ell_qr = Ellipse(xy=(0, 0), width=2 * axis_lengths_rrt[0], height=2 * axis_lengths_rrt[1],
                 angle=angle_q, edgecolor='blue', facecolor='none', label='QR Decomposition Ellipse')

# 8. 고유값 분해 (Eigenvalue Decomposition) 기반 타원 생성
eigvals, eigvecs = np.linalg.eigh(cov_matrix)
axis_lengths_eig = np.sqrt(eigvals)
angle_eig = np.degrees(np.arctan2(*eigvecs[:, 0][::-1]))

ell_eig = Ellipse(xy=(0, 0), width=2 * axis_lengths_eig[0], height=2 * axis_lengths_eig[1],
                  angle=angle_eig, edgecolor='red', facecolor='none', label='Eigenvalue Decomposition Ellipse')

# 9. 시각화
fig, ax = plt.subplots()

# QR 분해 기반 타원
ax.add_patch(ell_qr)

# 고유값 분해 기반 타원
ax.add_patch(ell_eig)

# 설정
ax.set_xlim(-40, 40)
ax.set_ylim(-40, 40)
plt.title("Comparison of Ellipses from QR Decomposition and Eigenvalue Decomposition")
plt.xlabel("X1")
plt.ylabel("X2")
plt.grid(True)
plt.gca().set_aspect('equal', adjustable='box')
plt.legend()
plt.show()

# 출력 정보
print(f"QR Decomposition Rotation angle: {angle_q:.2f} degrees")
print(f"Eigenvalue Decomposition Rotation angle: {angle_eig:.2f} degrees")
print(f"QR-based axis lengths: {axis_lengths_rrt}")
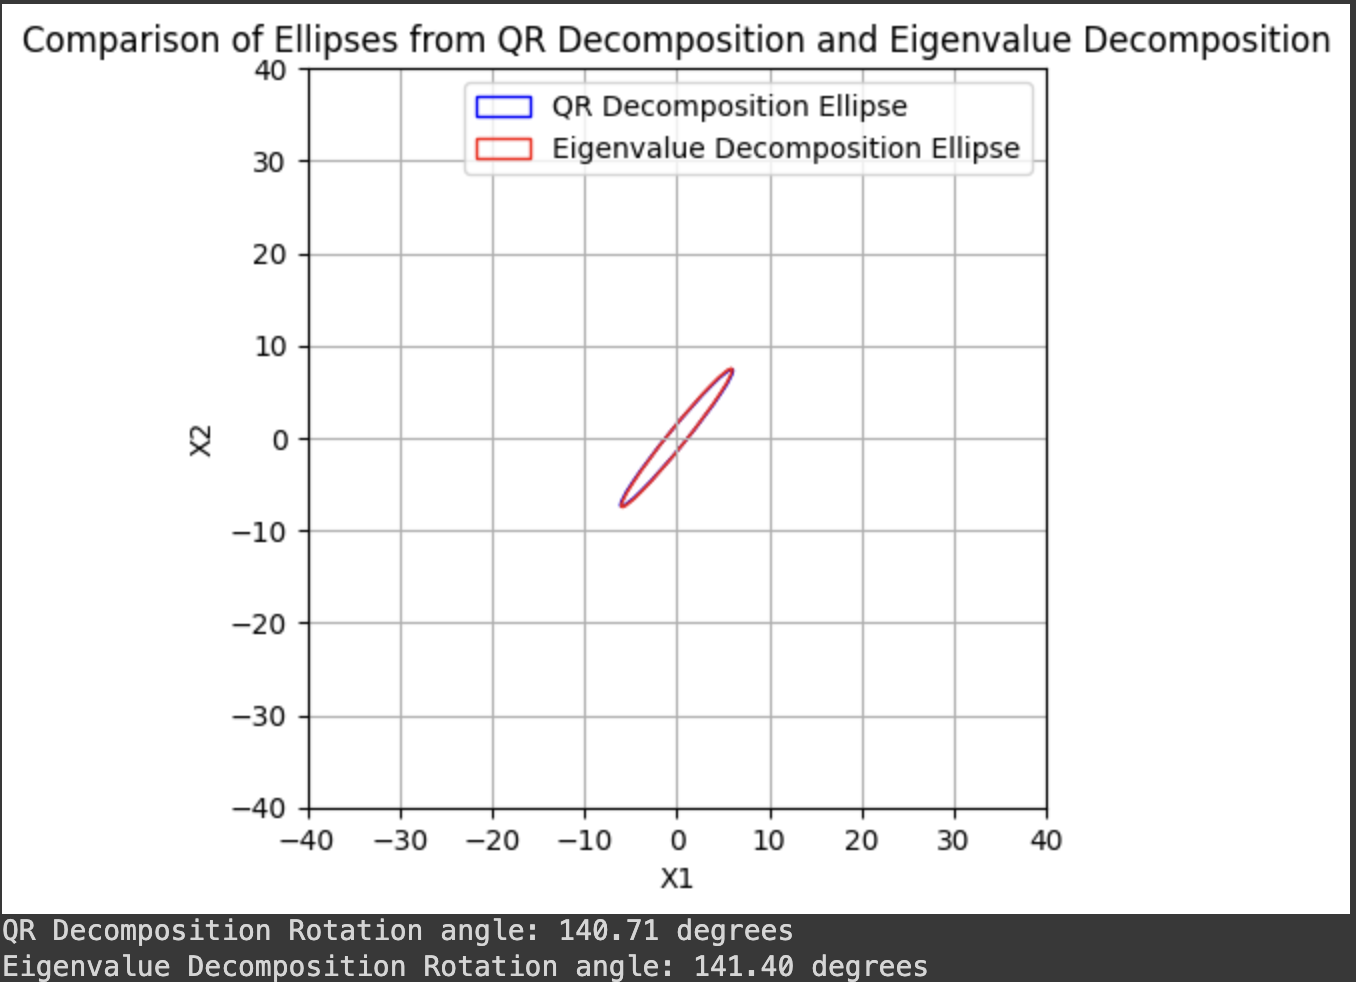
print(f"Eigenvalue-based axis lengths: {axis_lengths_eig}")| angle_q = np.degrees(np.arctan2(Q[1, 1], Q[0, 1])) | angle_q = np.degrees(np.arctan2(Q[0, 0], Q[1, 0])) |
 |
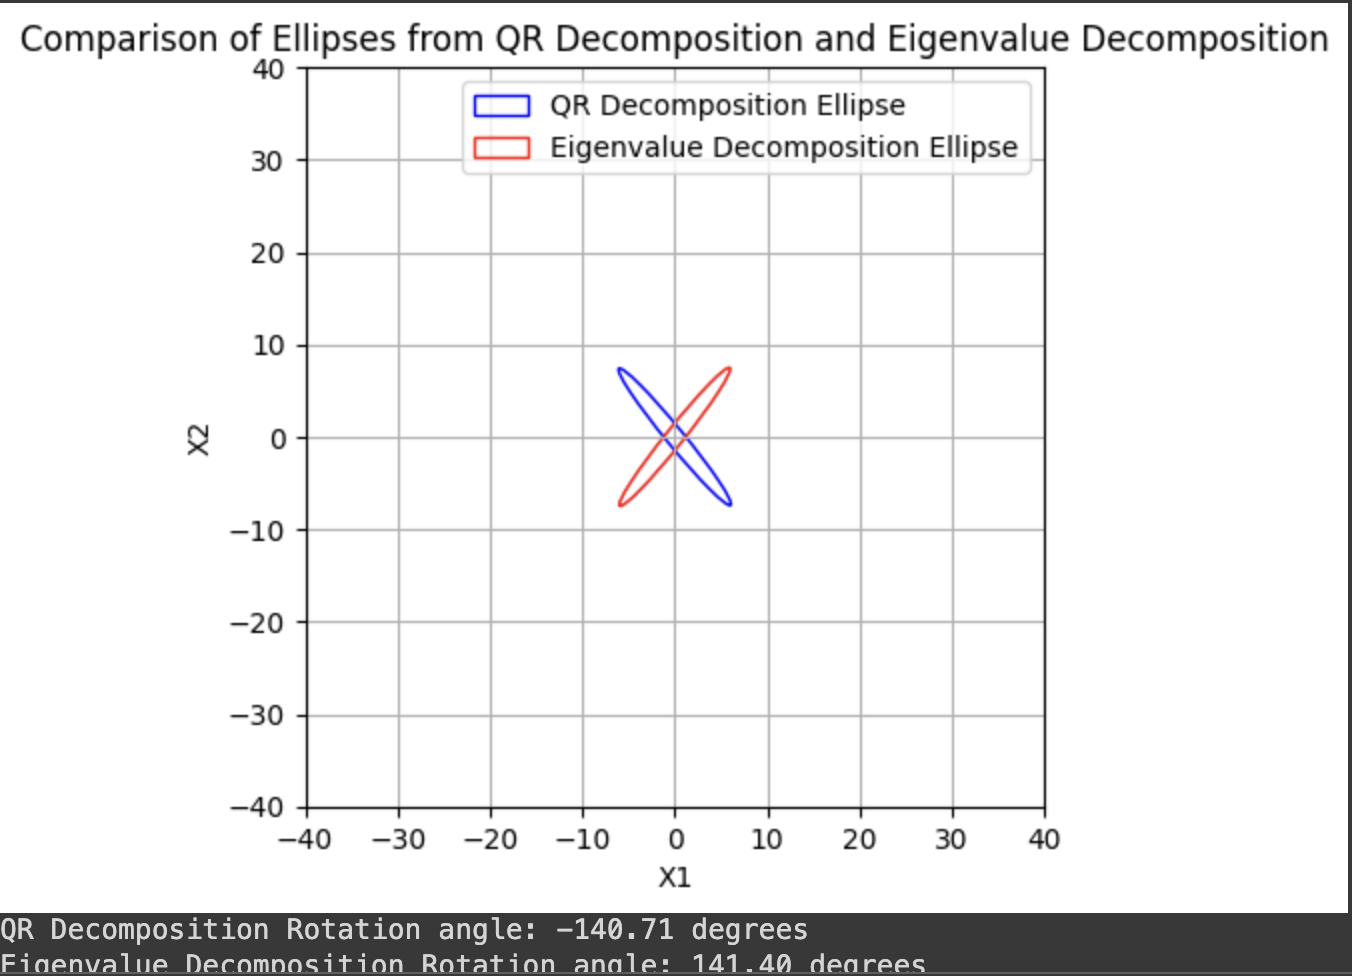 |
어떤 matrix에 관한 QR decomposition은 유일하다. Q는 orthonomal 한 matrix가 되고 각 축은 roation의 정도가 된다. RR^T의 2번째 열의 eigen vector가 더 크기 때문이다.
정리
Covariance matrix가 주어졌을 때 타원의 길이는 Covariance matrix의 eigen value에 속한다. Eigen vector의 방향이 기울기이다. variance가 타원의 길이 아니다. correlation은 Covariance에 두 std을 나눠서 구하되, 타원의 기울기는 아니다.
Code
https://drive.google.com/file/d/12LHY7WhmxMj90JUcCZyw2jA8eHovpq39/view?usp=sharing